Capstone Project: Week 8, Monitoring
Hey there! Welcome to my Week 8 update for my capstone project: Continuous Integration/Continuous Deployment Pipelines. This week's goal was to implement a monitoring service into my DevOps infrastructure, and for this task I chose the application Datadog which I will go over later.
There isn't much to talk about this week, so I expect this post to be a little shorter than normal, but without further ado, let's talk about the project!
Outcomes
- Datadog Monitoring - I have decided to go with and include Datadog monitoring as my monitoring service for my DevOps infrastructure. There are three main reasons for this:
-
- Datadog is free with the GitHub Student Developer Pack for two years so long as you keep your "servers" under 10. Thank's GitHub / Datadog!
-
- Datadog is is one of the most popular monitoring services used by companies today for it's wide breadth of features and ease of integration.
-
- It integrates well with Azure and Azure App Service, something that I was worried about when I decided to move on with Azure's PaaS, which offers an abstraction from the hardware which makes monitoring completely reliant on Microsoft.
-
- Near Completion of Basic Pipeline - With my monitoring service now integrated into my DevOps infrastructure, I have completed the basic goals established within my proposal.
-
The hard goals for this project, or requirements that are necessary to fulfill said solution, are creating a CI/CD pipeline that takes code from a repo, performs some tests on it, and automatically deploys it to a server while notifying a team service such as Slack for commits. Also, we will require an encompassing monitoring service for the application such as Data Dog, Grafana, or the Elk stack
- I will need to improve what I have greatly to feel comfortable presenting my project, but I at least have something that will be able to be submitted that satisfies my requirements.
-
DataDog Monitoring
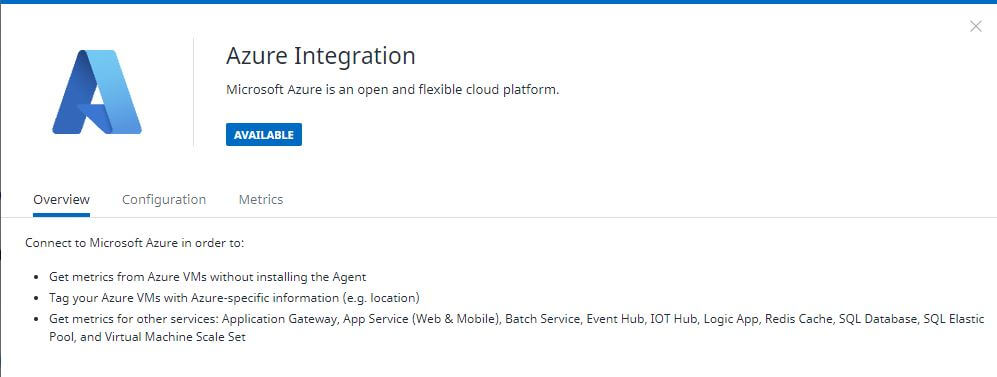
Datadog is a monitoring service that is able to quickly aggregate logs from all of your hosts or nodes and accurate and necessary information in real-time. Datadog has hundreds of integrations such as the ones I have used for my project thus far: Microsoft Azure, Microsoft Azure DevOps, and GitHub. Datadog is completely customizable in the fact that you can set custom alerts with your own specified conditions, create your own dashboards with whatever metrics you might desire, integrate security into your tools, and even customize testing directly within Datadog. It is a massive and wonderful software that I am going to spend a lot more time investigating before this project is finished.
To setup Datadog for my environment, I referenced only the Datadog Documentation. The documentation created by Datadog is great, and I found it fairly easy to integrate most of the things I needed into my application. While DataDog is built for physical hosts in mind, which is what the "Getting Started" page is going to help you with, I first started with integration with Azure as I am using Platform as a Service.
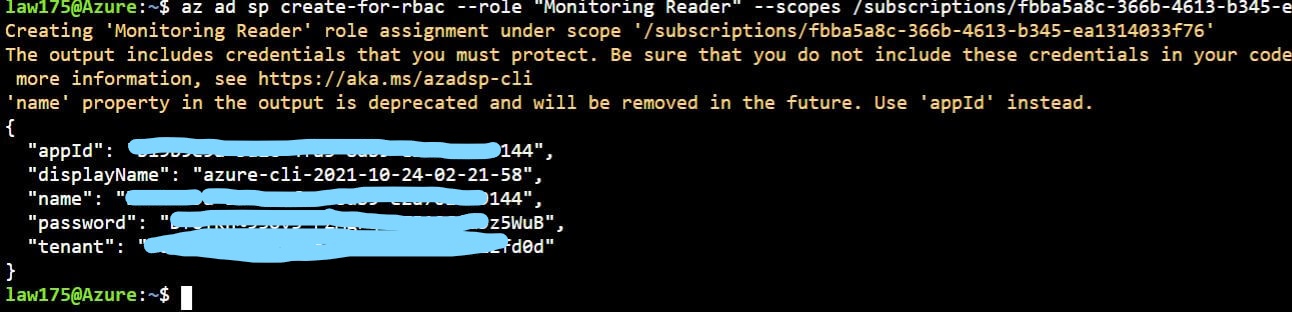
To get this integrated, I followed the documentation found here. I am not going to go too much detail in the installation process as I followed the guide found there, but I do want to admit to the fact that you only have to do one of the methods to integrate with the Azure Portal. I went ahead and did both, which took a lot of extra time, haha. The first method is easy, using the CLI, in that you just create a role for DataDog that has a role of "Monitoring Reader" so that it can collect all of the logs in your Azure portal. You then just get the ID's necessary and plug them into the Datadog integration tile!
After you setup the role for Datadog, you need to actually forward the logs to Datadog. To do this, I just went with the automatic installation script that they provide. NOTE: be sure to specify the region you want to monitor when you run the automatic script as an argument!.
./activity_logs_deploy.ps1 -ApiKey <api_key> -SubscriptionId <subscription_id>
I unfortunately did not add in the -ResourceGroupLocation eastus parameter as an argument which defaulted all of the resources such as the newly created Azure Event Hub to collect and forward logs only in westus. I quickly realized my issue, but cleaning up the mistake took a bit of time. However, after a bit of trial an error going through this process, I was able to start linking my Azure platform to Datadog!
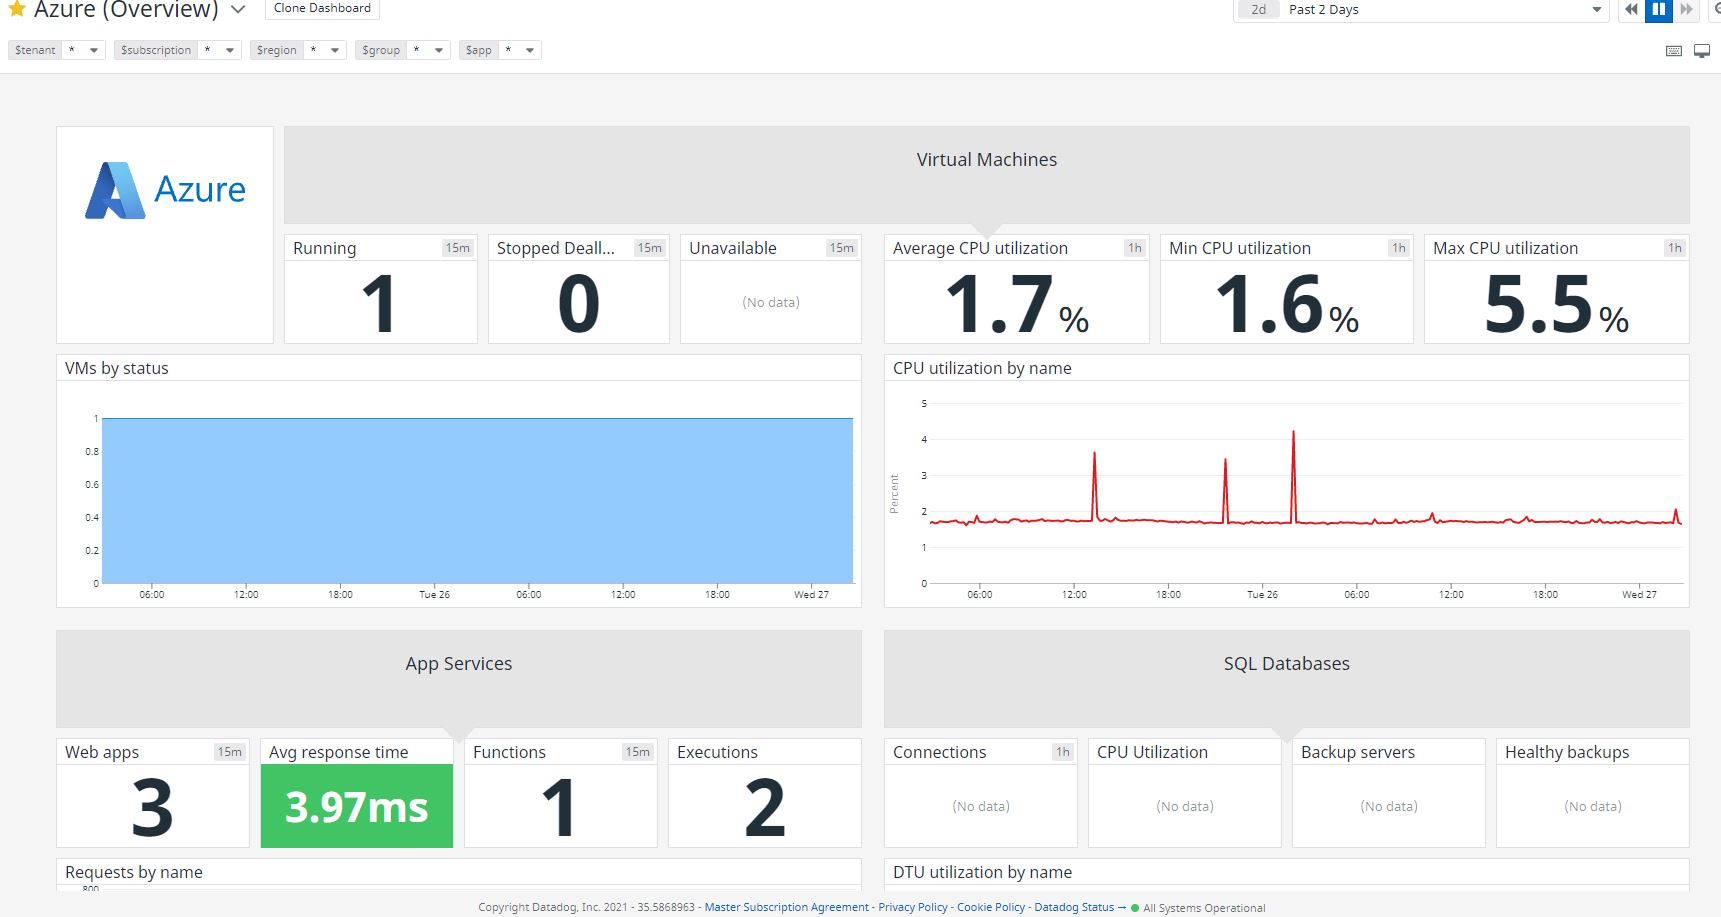
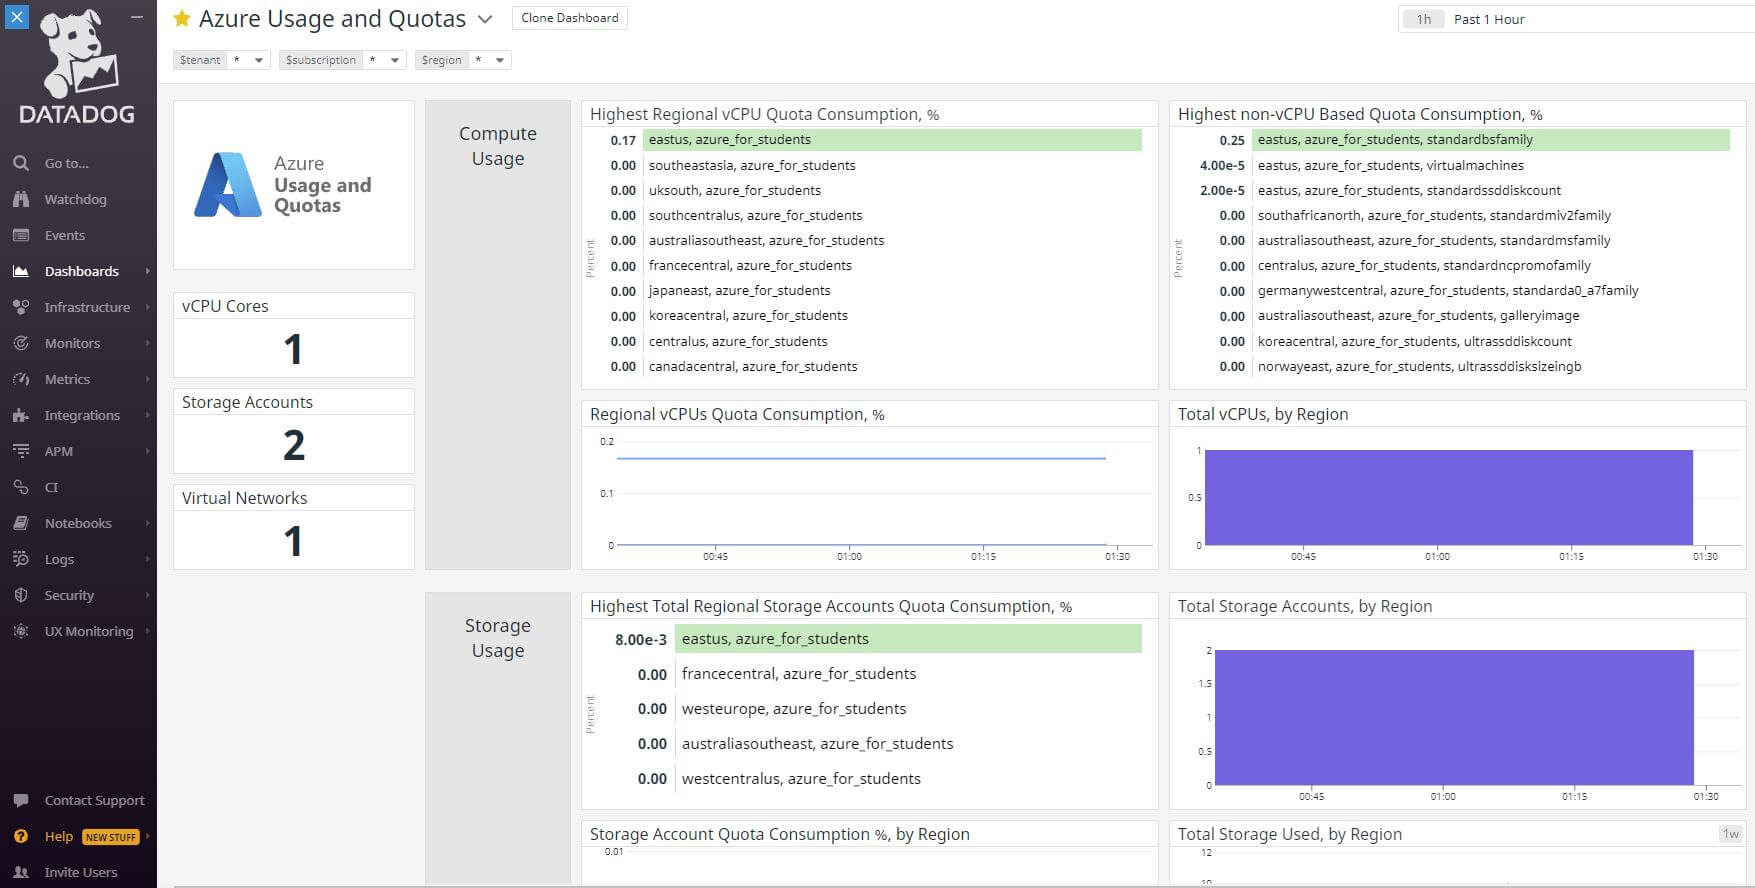
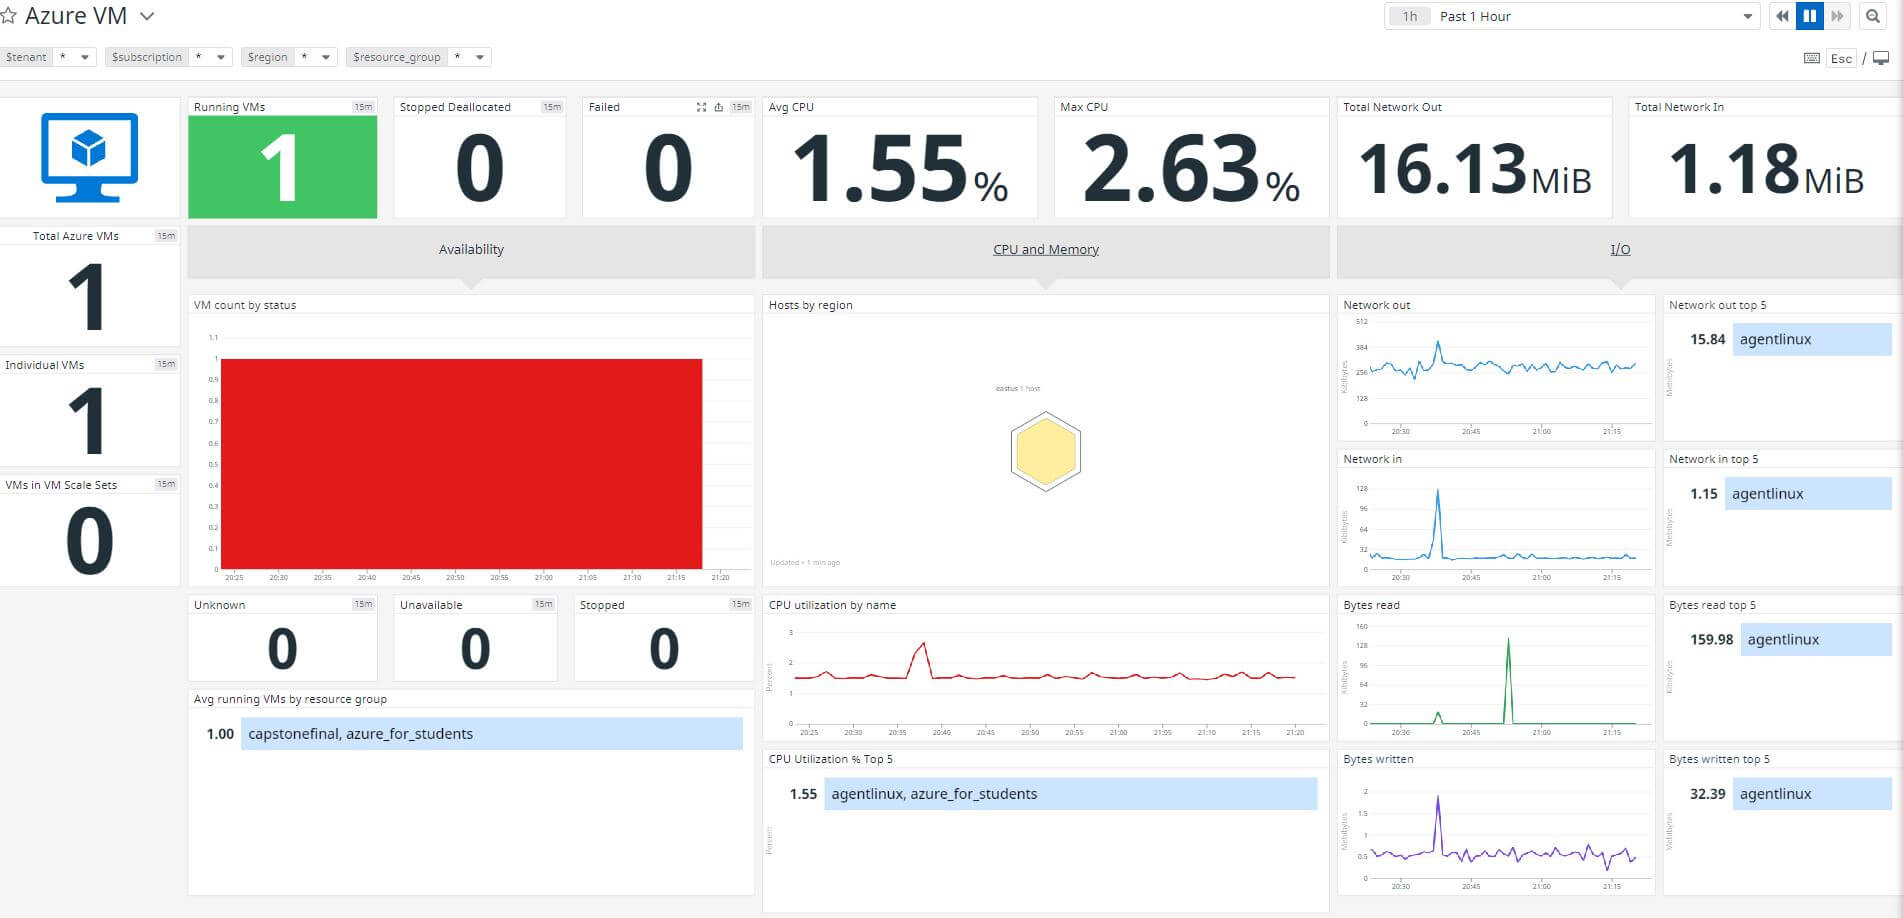
As you can see in the pictures above, you can monitor your entire Azure platform. Nearly every service can be tracked, as well as usage for subscriptions and more. This is done by a crawler created by Datadog that collects metrics. This is a really nifty tool! Datadog comes with these premade dashboards to help get you up and running quickly, though you can easily make your own dashboard with whatever you may need.
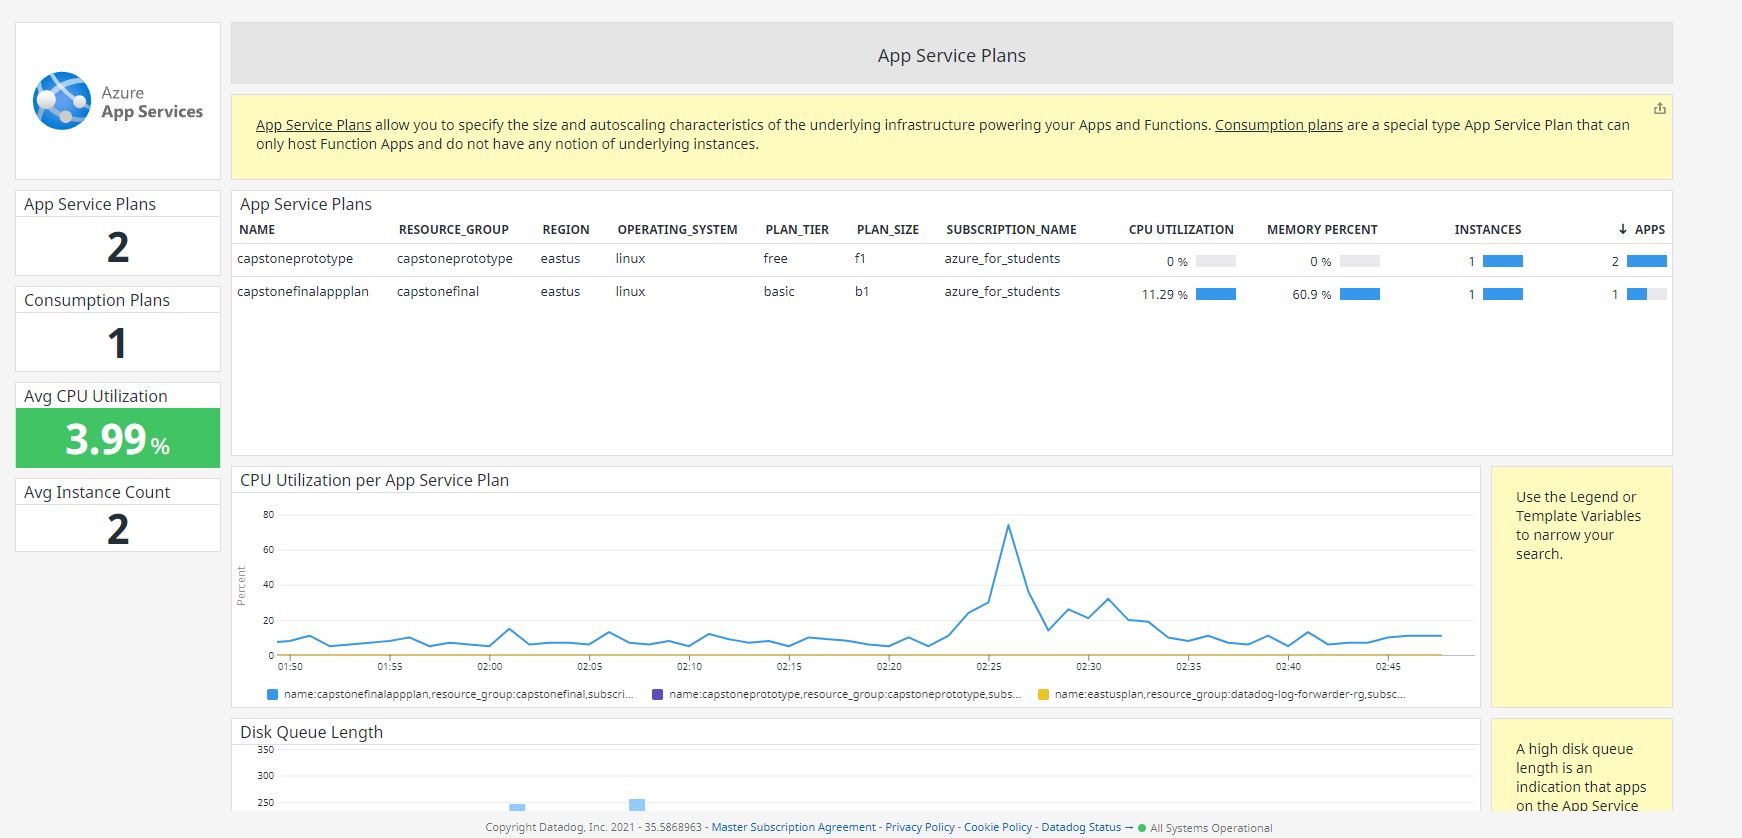
What is also nice is that Datadog includes monitoring for Azure App Services. While there is a lot of data that can come from the default Datadog integration, the best way to get data out of your Azure App Service Web Applications is to install the Datadog App Service Extension. This extension I believ will allow you to collect almost as much data as if you installed the agent directly on the host. Unfortunately, Azure does not support App Extensions for apps utilizing Linux as the app's base. To get a more in-depth monitoring solution for Linux App Service containers, I may have to utilize what Microsoft provides.
Datadog Azure DevOps
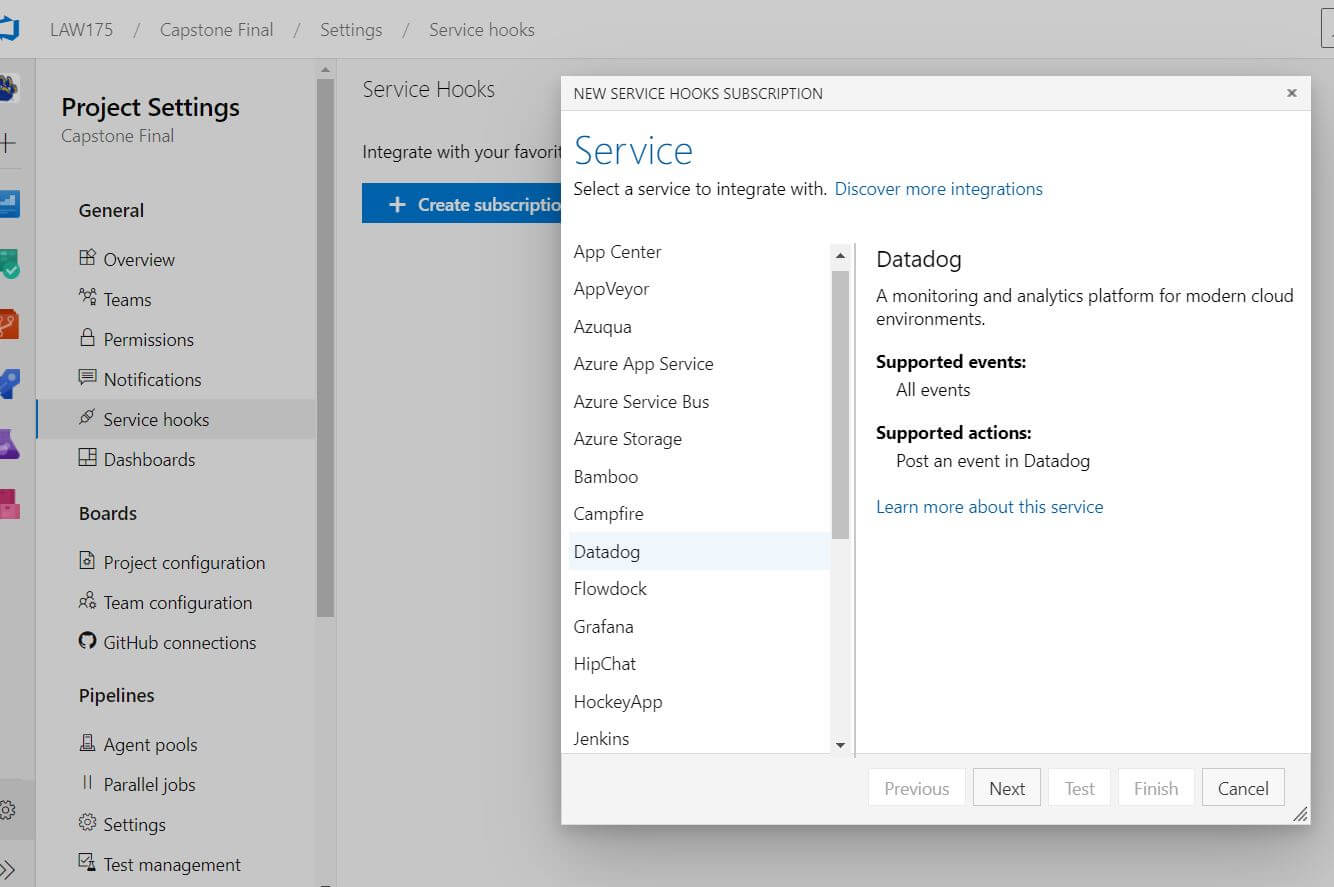
Another cool feature offered by Datadog is its intergration with Azure DevOps, something that I just did not expect. To do this, you just select the Azure Datadog integration within the Datadog site, and then link the service connection in your Azure DevOps project.
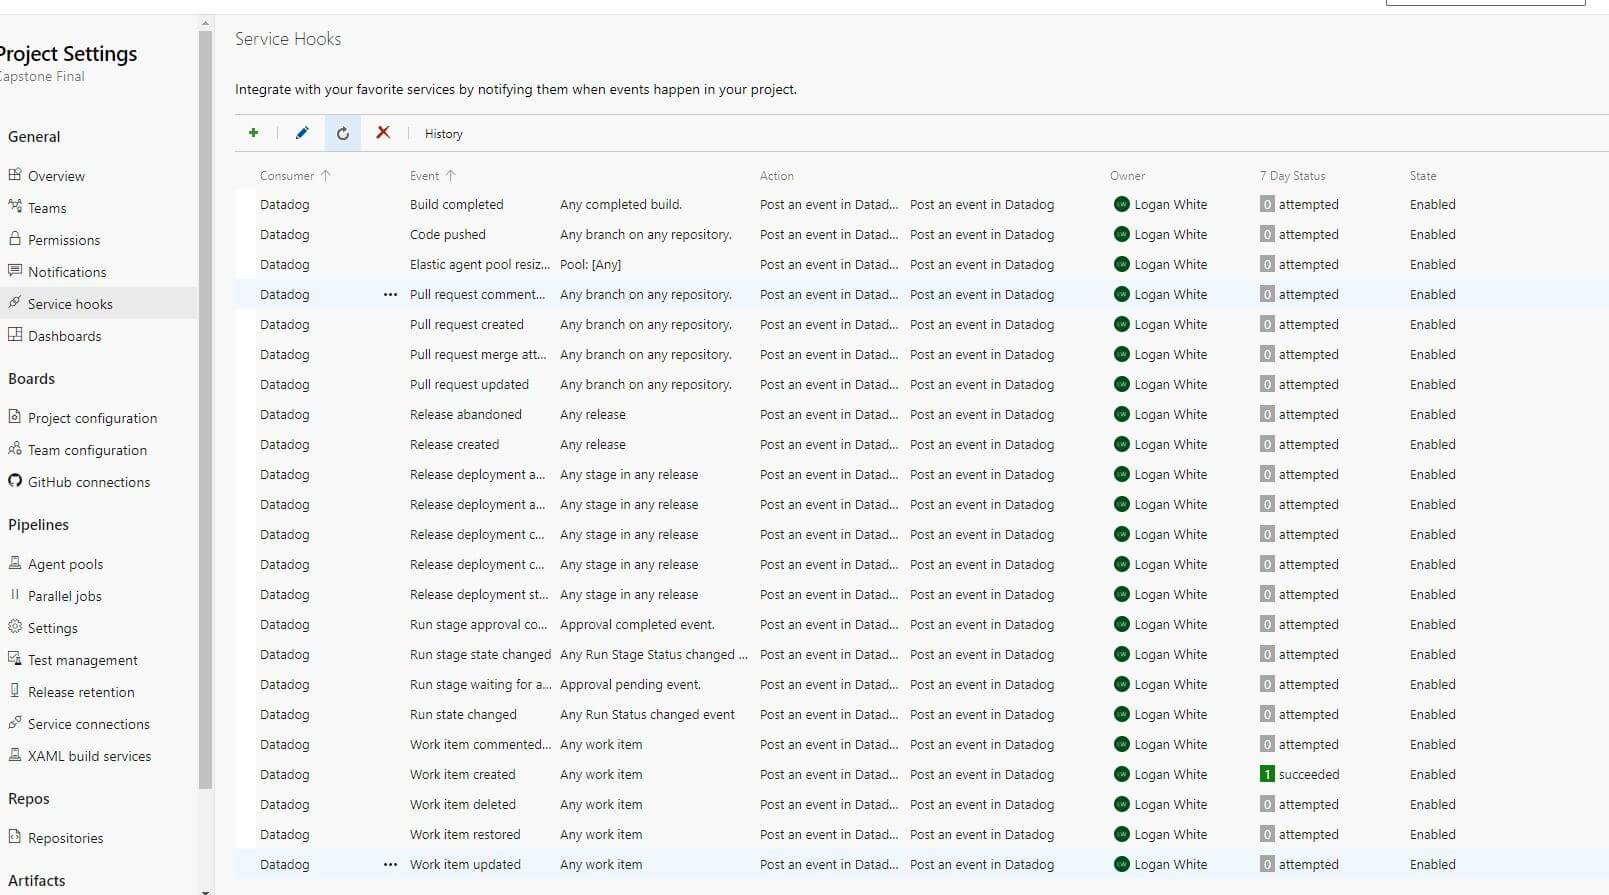
From there, you simply create webhooks that will automatically send data about various pieces of Azure DevOps directly to Datadog, like so:
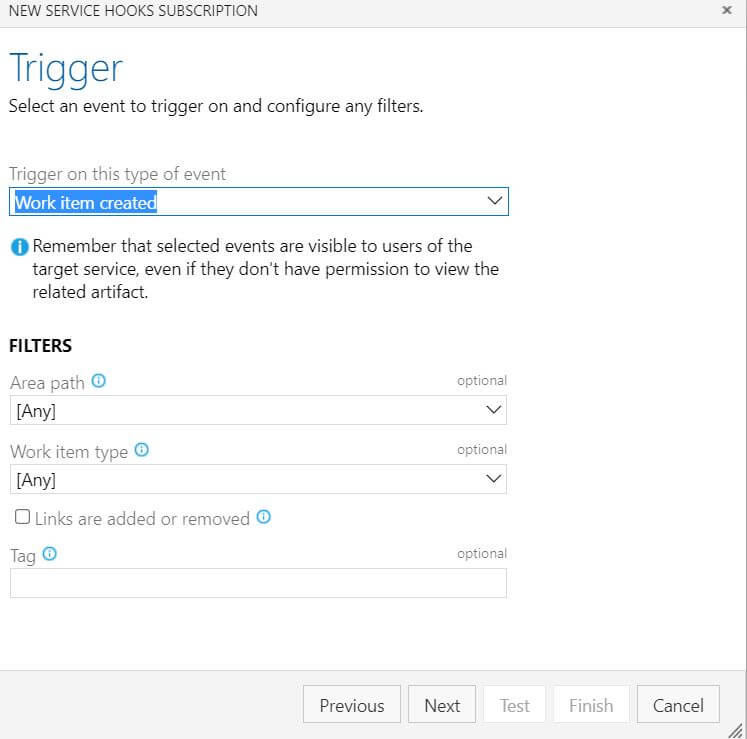
I decided to just go with all of the webhooks available, which amounted to quite a lot. There is a programmatic way to create these webhooks in your project, but I was able to finish this task in roughly 5 minutes so it wasn't a huge deal.
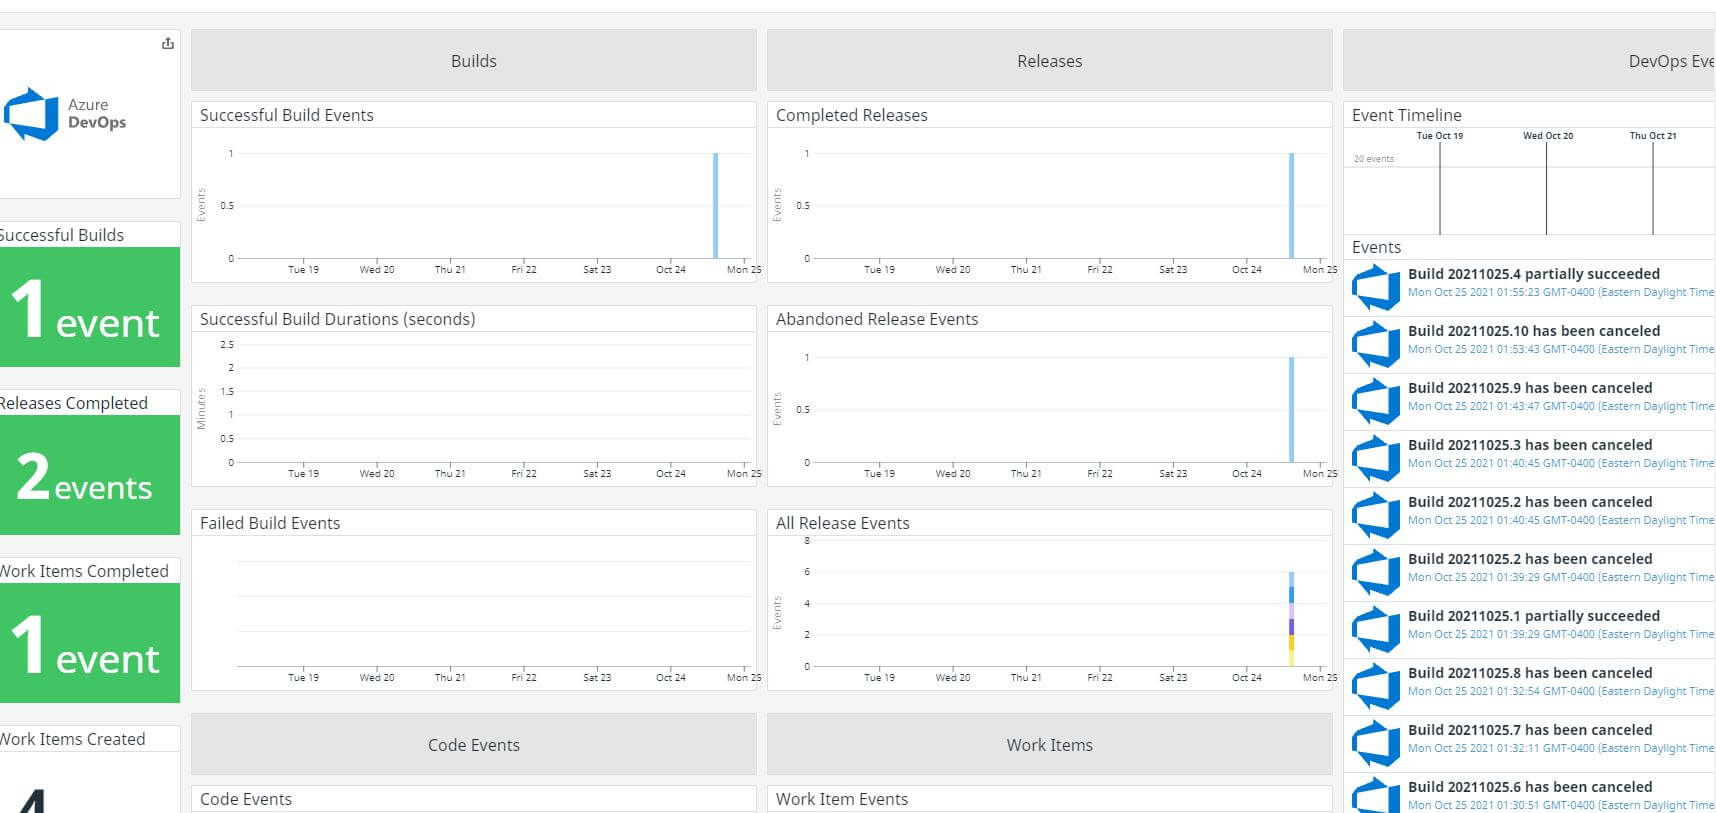
Once this was done, I now even had a monitoring service for my Azure DevOps project! This integration is definitely nice to have, but it is a little finicky in that some parts don't seem to be reporting as it should, such as when I ran the tests that come with the integration. Regardless, this is still a wonderful feature that I will want to explore more!
Datadog VM
The next thing I did was create a new virtual machine on Azure that hosted Ubuntu Linux 20.04 LTS. I did originally create the same virtual machine in an earlier blog post, but I had since decided to move to PaaS, and thus this was costing me money for no reason. However, I want to get more data for my Datadog environment, just to bring it more to life.
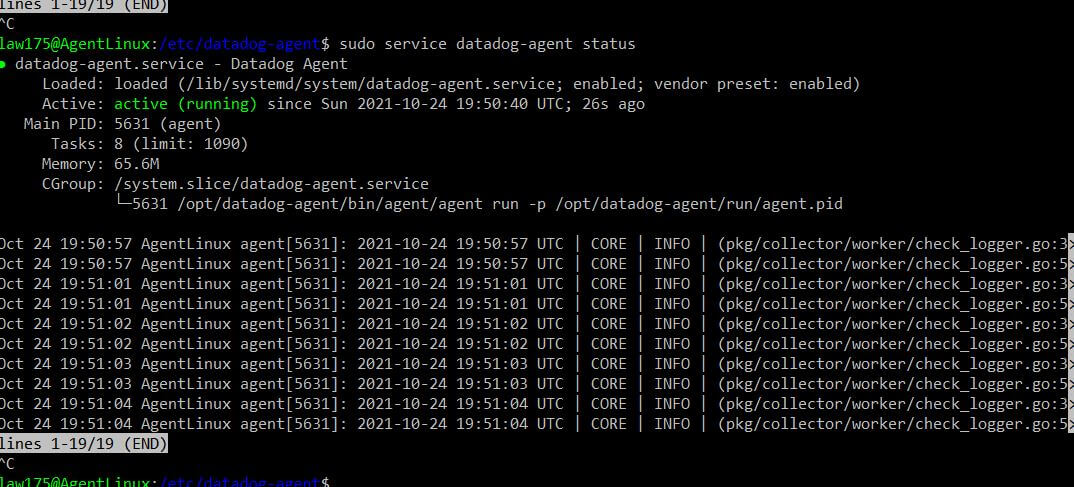
Installing the agent is as easy as using apt-get install, or you can boot up a server with Datadog already on it directly with an Azure extension. Just like that, I have monitoring on my new server that reports all of the computational statistics I need!
However, this process only only collects simple metrics about your Virtual Machine and not things like logs and processes currently being utilized on your host.
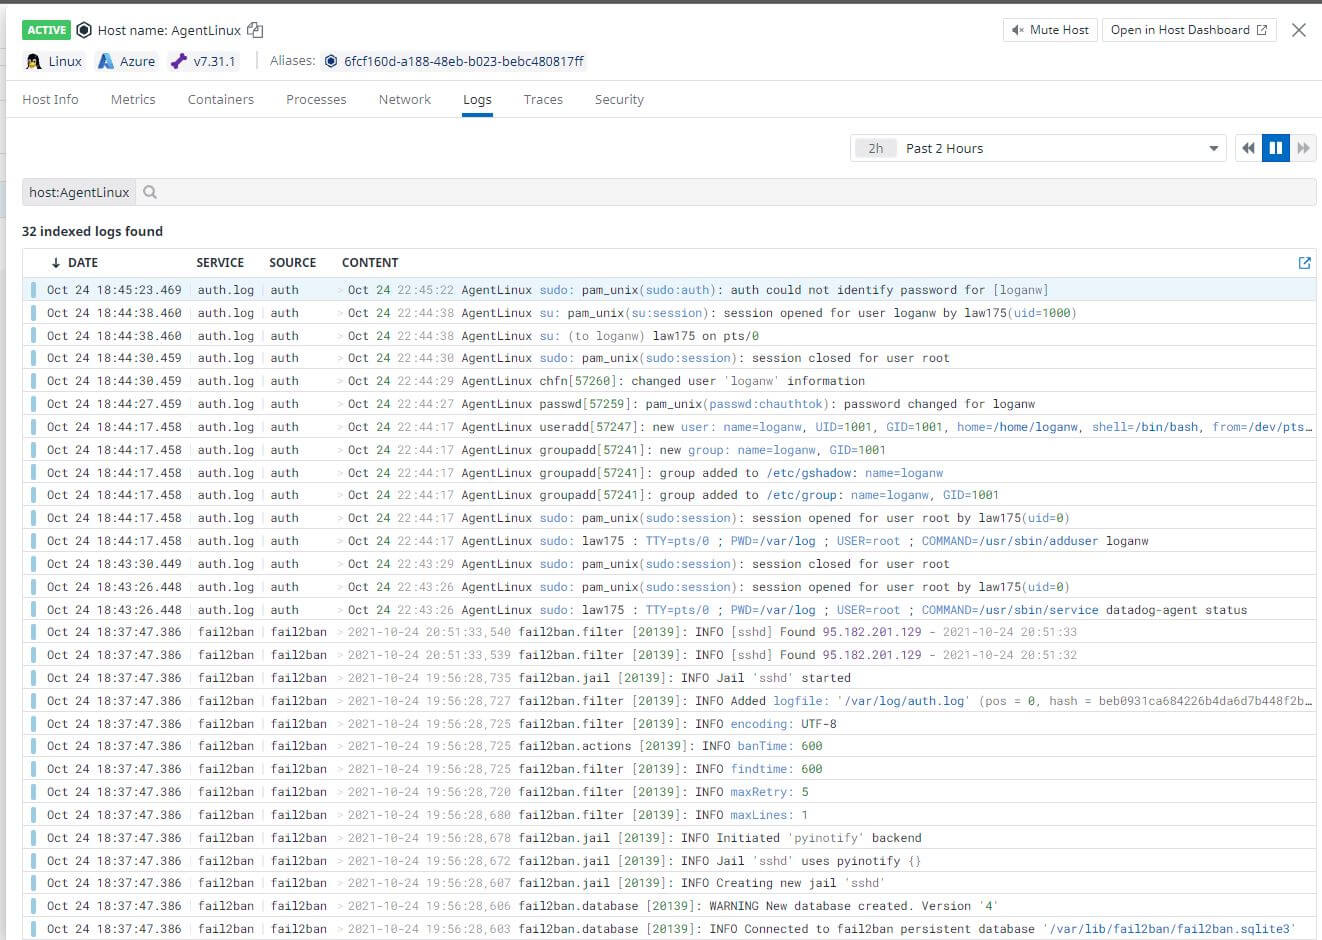
To collect specific logs of my choice, I used the config file generator found here on the Datadog website which allows you to quickly create and configure the files you need to extract from certain applications. I utilized this to collect logs from fail2ban, my auth.log, and various other logs besides the ones that come with the agent.
To enable logging, I simply enabled log collection within the datadog.yaml file. Then, I simply made a new directory in the /etc/datadog-agent/conf.d/ directory for each of my specifc log files I wanted, and create the <appname>conf.d.yaml file in that directory and gave it permissiosn for Datadog to read it. This config file looks like this:
 1#Log section
 2logs:
 3  # - type : (mandatory) type of log input source (tcp / udp / file)
 4  #   port / path : (mandatory) Set port if type is tcp or udp. Set path if type is file
 5  #   service : (mandatory) name of the service owning the log
 6  #   source : (mandatory) attribute that defines which integration is sending the log
 7  #   sourcecategory : (optional) Multiple value attribute. Can be used to refine the source attribute
 8  #   tags: (optional) add tags to each log collected
 9
10  - type: file
11    path: /var/log/fail2ban.log
12    service: fail2ban
13    source: fail2ban
And with that, I got log reporting working! Datadog now automatically streams the logs of my VM directly to the Datadog website and displays it in a clean way!
One final step I did was also bring in processes that are running on a virtual machine which also requires more configuration. You can find the documentation I used to integrate "Live Processes" here. You can also set filters to make sure you don't accidentally report sensitive information directly in the configuration file.
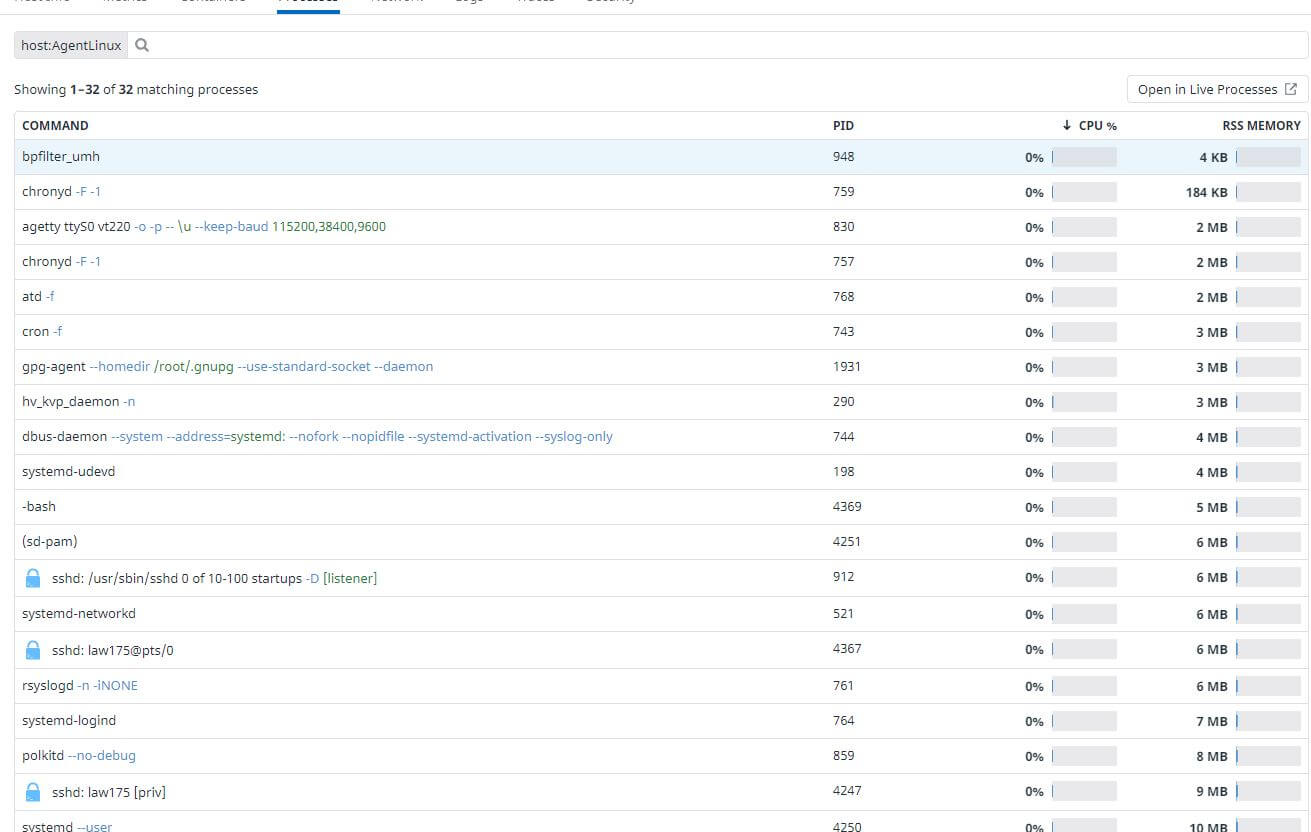
The process of configuring the Virtual Machine, installing the Datadog agent, and modifying the Datadog agent to report logs and processes had taken a significant amount of time, which makes me appreciate and understand the importance of Ansbile. This would make deployment of datadog to my infrastructure a whole lot easier!
Datadog Other Features
There are a lot more features found in Datadog that I will probably not use in my project, but here are some things I would like to mention that I may include in the project.
UX Testing
Datadog allows you to do web browser testing similar to Selenium in the fact that you can interact with JavaScript and other website elements on your website directly from within Datadog which will record those actions and replicate them through various servers across the world. This is done via a web browser extension, which could be considered a security risk, but you are able to uninstall it immediately after the test is done.
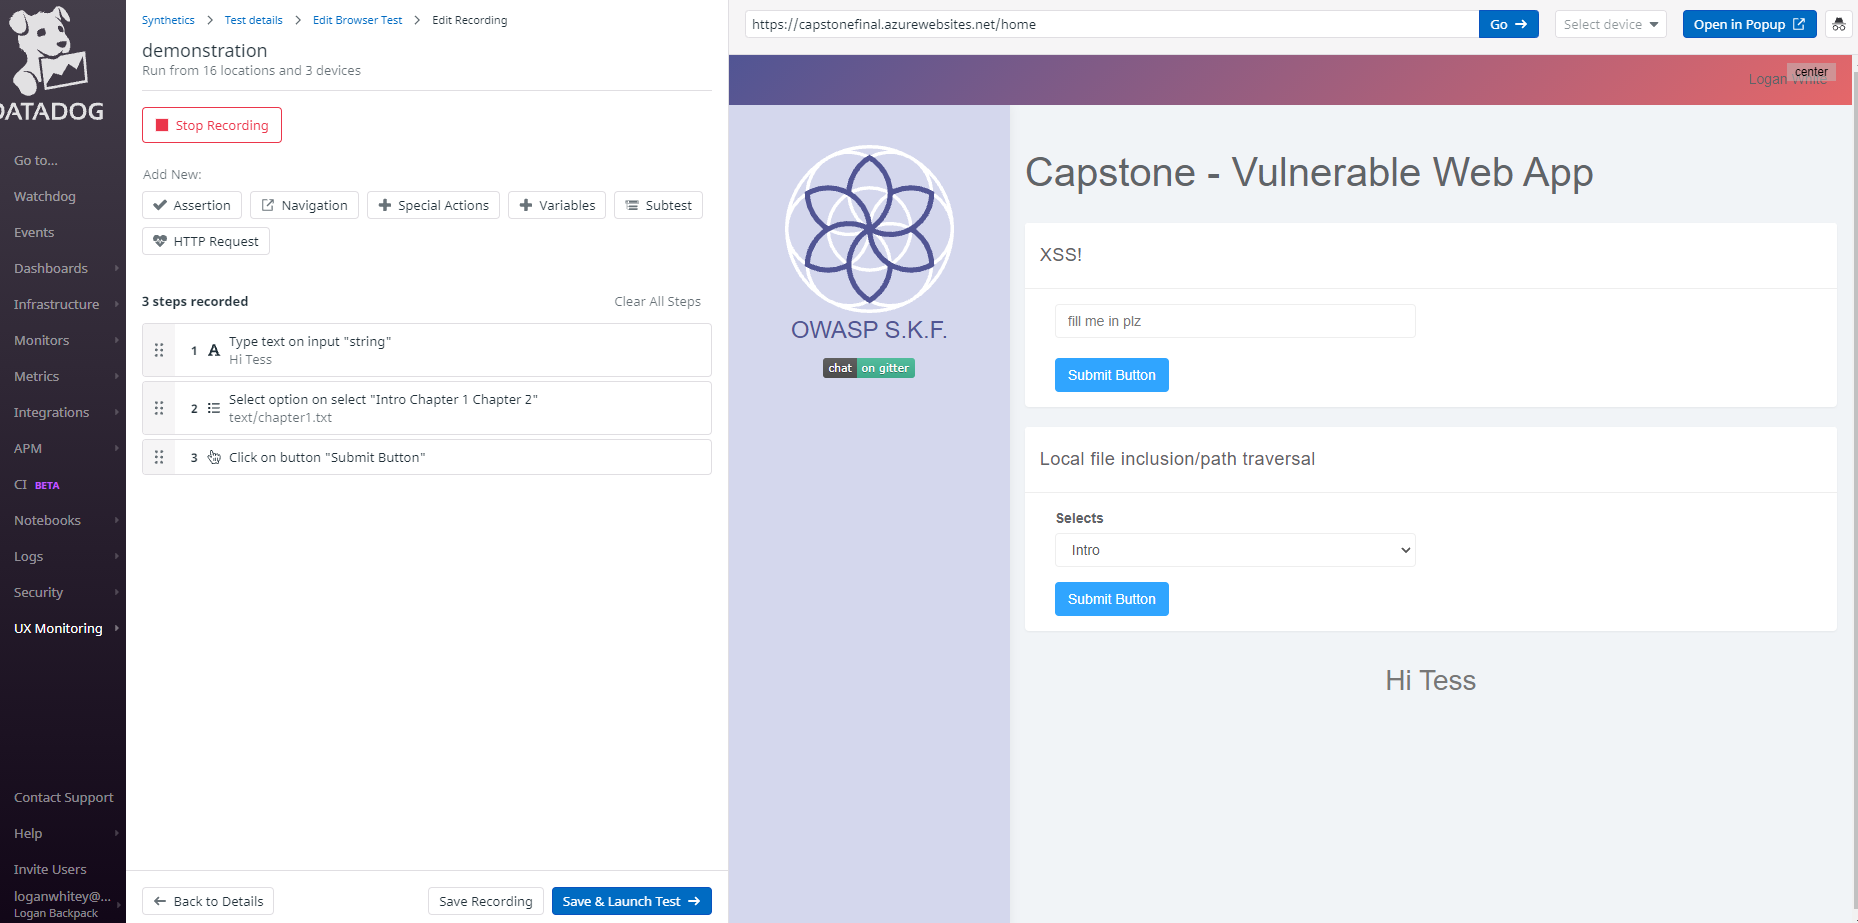
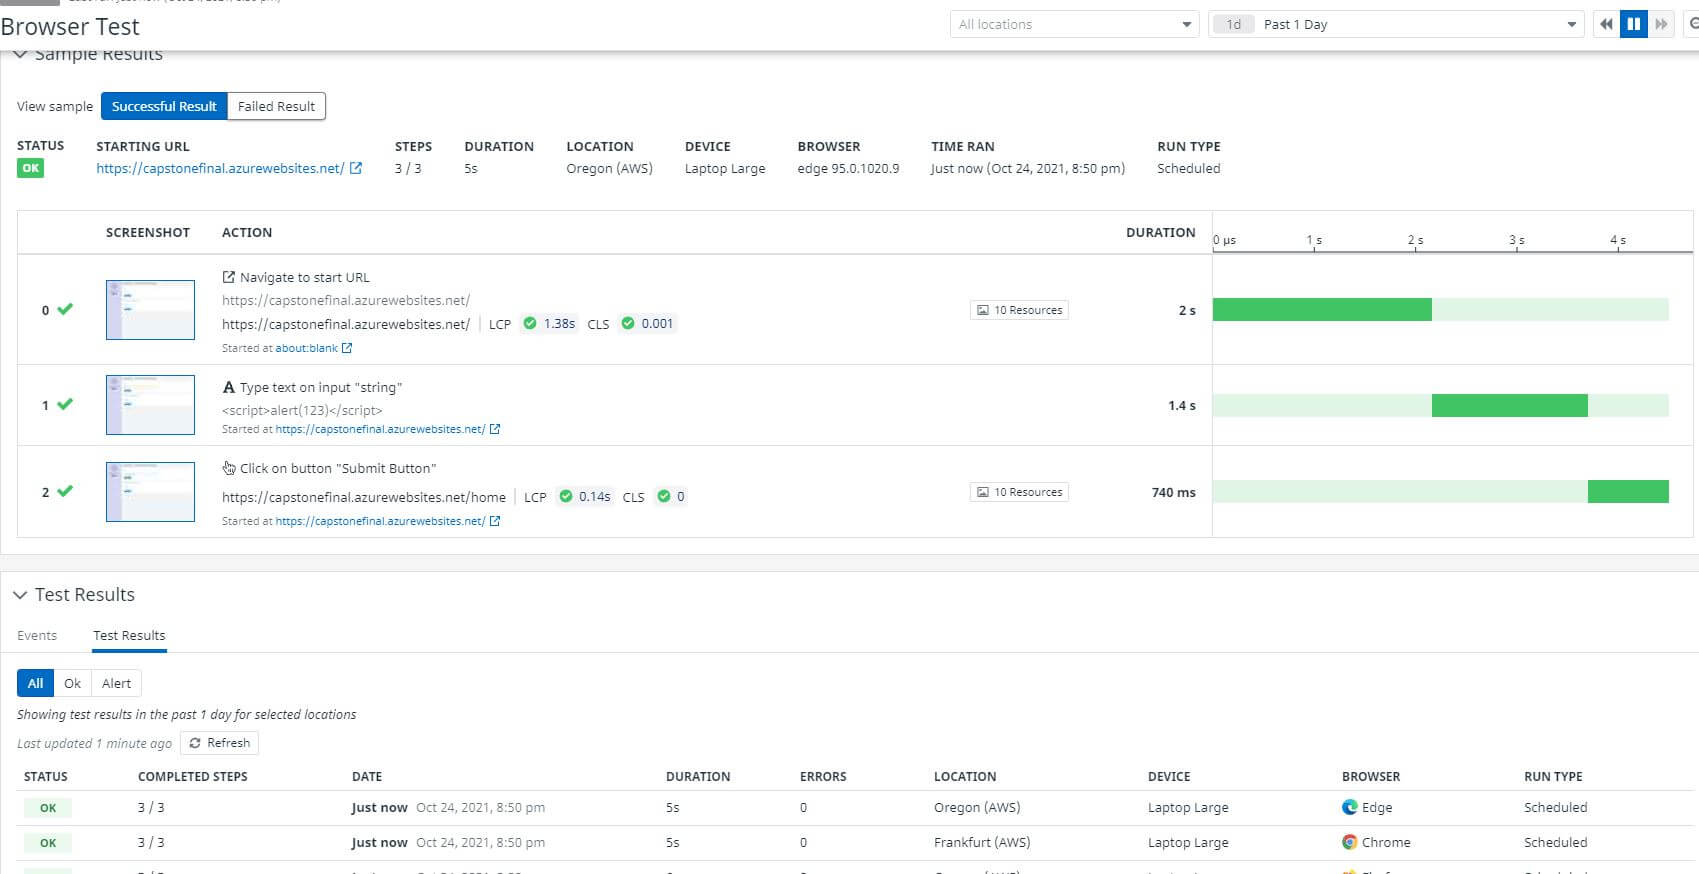
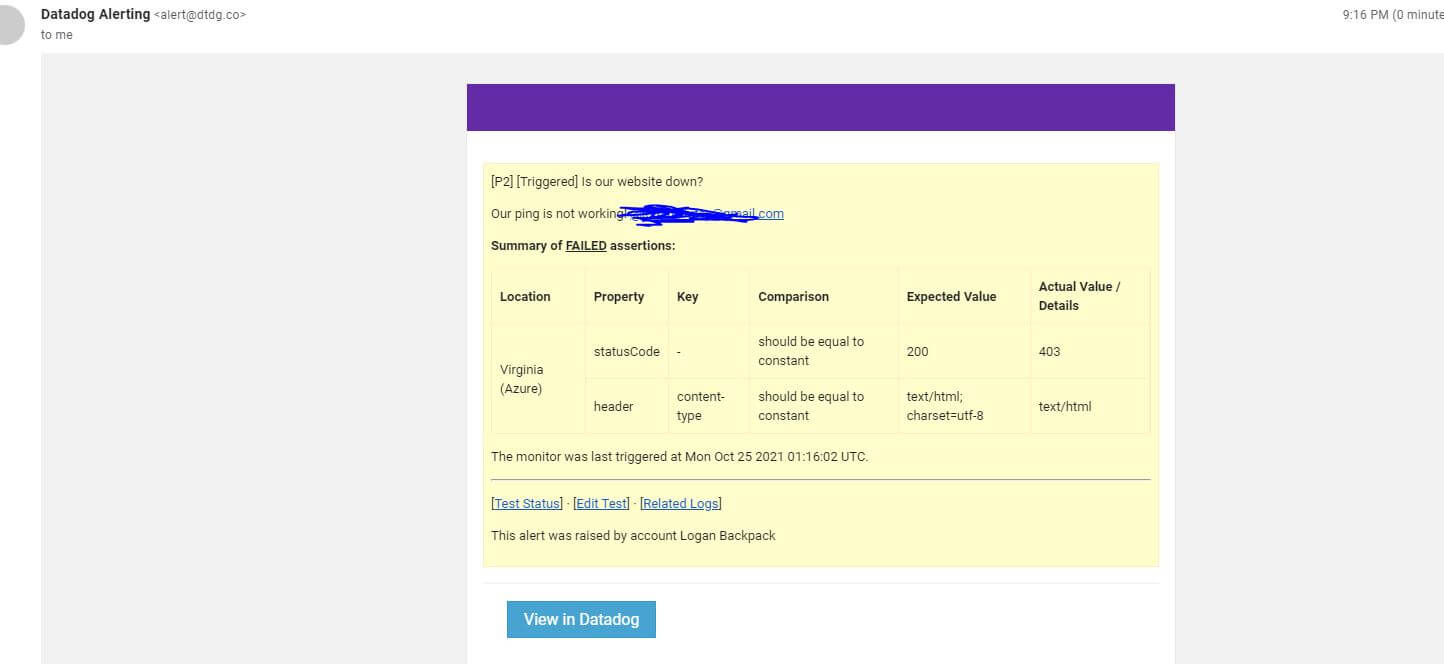
When you create this test, you can also define parameters for what is success and what is failure, such as defining how many hosts are allowed to not reach your website before reporting an alert or error, depending on your specifications. For example, I configured a monitoring alert message if one of the servers were to be unable to reach my website and complete a successful git request. It failed, and I was instantly emailed by Datadog about the alert.
This process can also be incorporated into your CI/CD Pipeline, though it seems that it only offers official support for Continuous Integration tools besides Azure DevOps, such as GitLab and Jenkins. I'm sure there would be ways to integrate it with Azure DevOps anyway, and I will be looking to see how to make that happen.
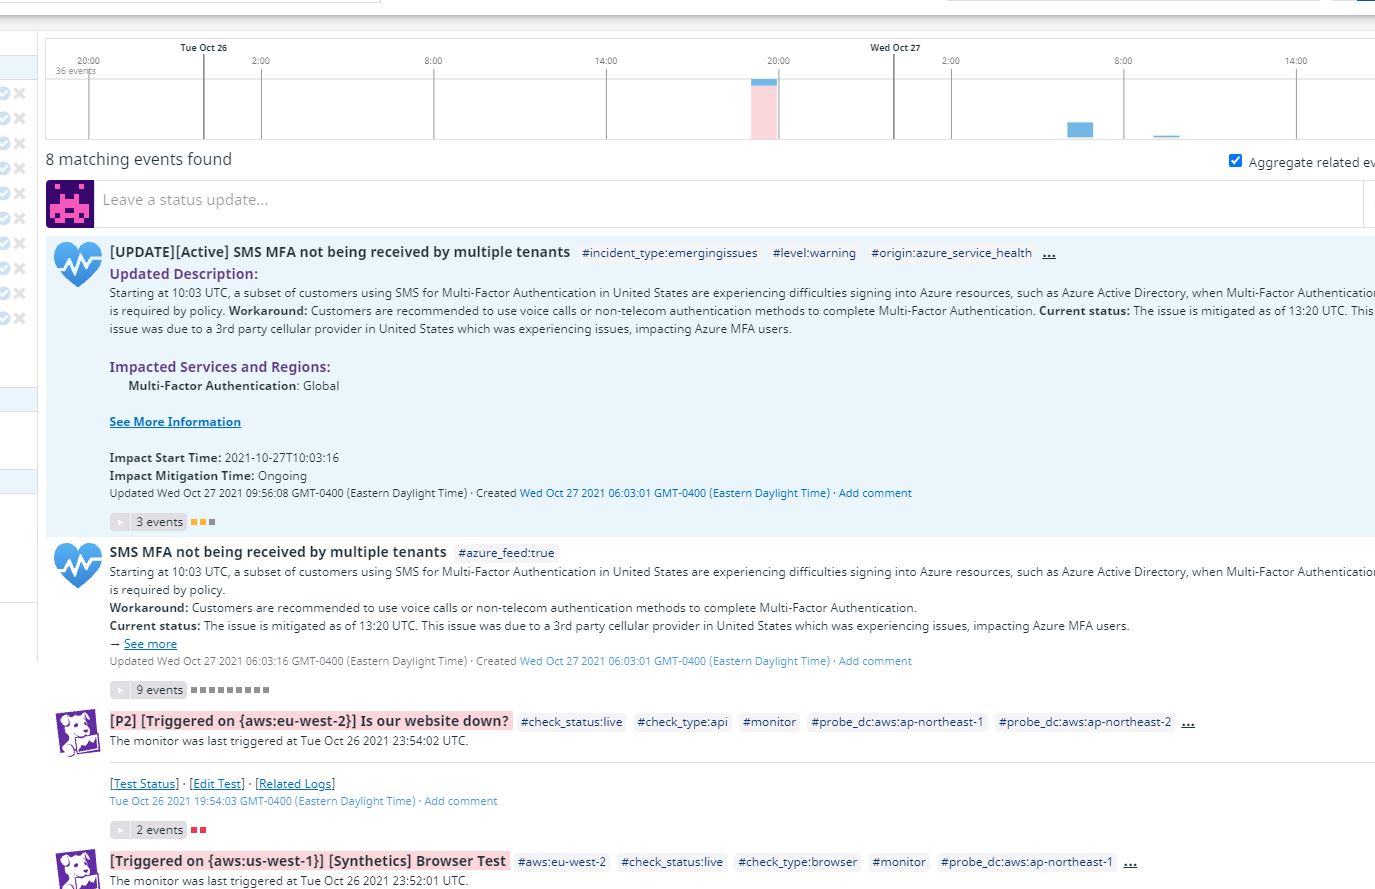
Event Stream
Any events or notifications you configures, plus events triggered by your integrations will automatically be posted on the Events page of Datadog, providing a convenient location to get all of the important information you need instantaneously.
Webhooks
As mentioned before with Azure DevOps, Datadog uses Webhooks quite frequently for relaying information as it is a really good method. Besides Azure DevOps, I have also integrated it with my Github repo to provide me with more information about my project.
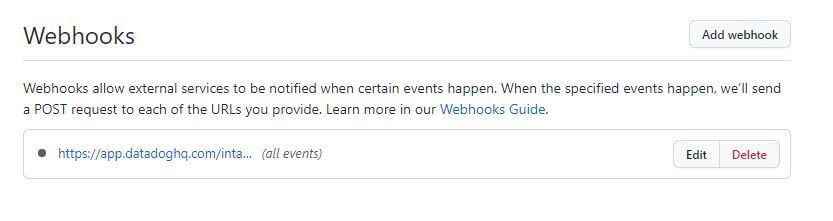
Datadog I believe also supports sending out webhooks based on certain parameters, which I plan to incorporate into my other methods of communication such as Slack here shortly.
Modification to Pipeline
Real briefly, I made a quick change to my initial pipeline as I finally began to tackle the issue of there being only one pipeline. This pipeline tests, builds, and deploys, which is not really that great of an idea as this would be triggered for all branches. If I make a new branch and commit my changes, this pipeline will automatically attempt to deploy it even if it is broken or bugged, unless it fails in my testing stages.
I knew I need to separate it, and for now what I decided to do was to create multiple pipelines, one that targeted the main branch and one that targeted every other branch. I was able to do this by modifying the trigger section of the original azure-pipelines.yaml file.
1trigger:
2  - main
After that, I created azure-pipelines-1.yml file which will be detected through Azure DevOps which only contained the testing stage and included all branches besides main.
 1trigger:
 2  branches:
 3    include:
 4      - "*"
 5    exclude:
 6      - main
 7
 8variables:
 9  buildConfiguration: "Test"
10  webRepository: "capstonefinal"
11  tag: "$(Build.BuildId)"
12
13stages:
14  - stage: "Test"
15    displayName: "Testing"
16    jobs:
17      - job: "Test"
18        displayName: "Test Job"
19        pool:
20          vmImage: "ubuntu-20.04"
21        steps:
22          - task: CmdLine@2
23            displayName: hadolint
24            inputs:
25              script: "cat $(Build.SourcesDirectory)/Dockerfile | docker run --rm -i -v $(Build.SourcesDirectory)/hadolint.yaml:/.config/hadolint.yaml hadolint/hadolint > $(Build.ArtifactStagingDirectory)/output.txt && cat $(Build.SourcesDirectory)/Dockerfile | docker run --rm -i -v $(Build.SourcesDirectory)/hadolint.yaml:/.config/hadolint.yaml hadolint/hadolint"
26              workingDirectory: "$(Build.SourcesDirectory)"
27            continueOnError: true
28          - task: WhiteSource@21
29            inputs:
30              projectName: "CapstoneFinal"
31          - task: PublishPipelineArtifact@1
32            inputs:
33              targetPath: $(Build.ArtifactStagingDirectory)
34              artifactName: hadolintOutput
While this worked, there was an issue. The azure-pipelines1.yaml file in the main branch still picked up pushes to all other branches. When I would checkout a new branch based on the main branch and bring over the two pipeline files, both the azure-pipelines1.yaml file in the main branch and the one in the other branch would fire. This is a huge issue. For now, I simply disabled the azure-pipelines1.yaml file in the main branch so that it will not run.
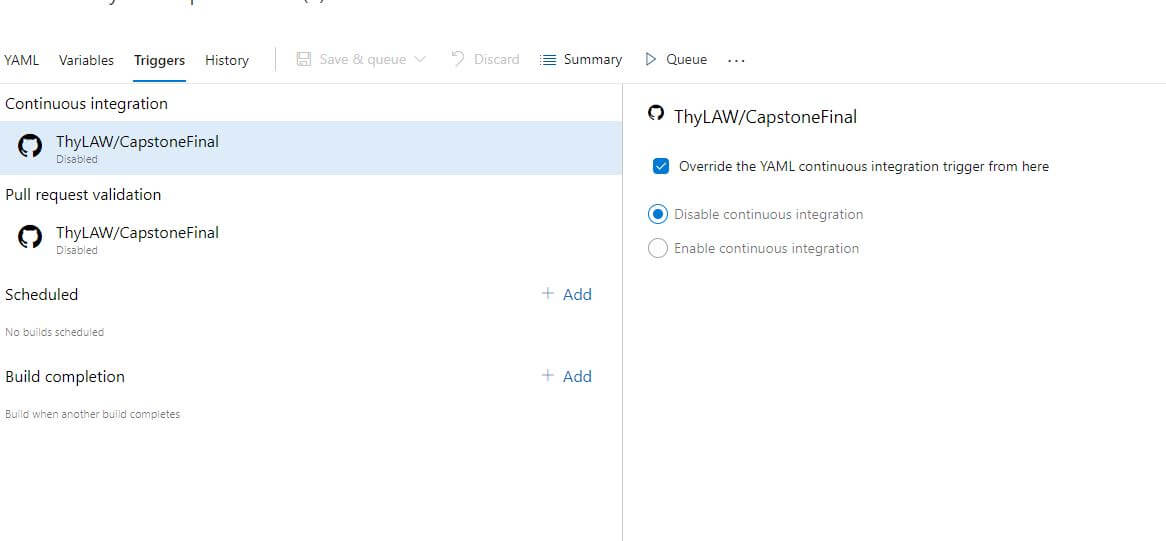
However, this does not solve the issue for multiple branches as they would also trigger on other branch commits. For now, I only can manually set the pipeline too listen to the branch it is in within the GUI of Azure DevOps. This is not what I want to do, as it is taking away from the time saved from the automation of DevOps, even if you only have to set it once. This can also cause conflicts if a team member forgets to set the pipeline to trigger only for his repo. While it wouldn't cause any damage, it would hold up the pipeline for about a minute.
Conclusion
In conclusion, I was able to setup monitoring this week with Datadog, and I was able to temporarily fix a problem with my pipeline. However, I am not satisfied my knowledge or implementation of both of these methods so I will be looking to improve them for next week. This will require me to really hammer in the concepts of Azure Pipelines and how to use it so that I can improve my pipeline and not have to be stuck at all from this point on. I may go back and fix the sloppiness of my hadolint linter as well. With that in mind, it seems like my goal for next week is to simply improve what I have for now, and then I can move on to adding more to my pipeline!
Thank you and see you next week!